quinta-feira, 20 de julho de 2017

Working with centralized logging with the Elastic Stack

When we opt for a microservice-based architecture, one of the main problems we are about to start is
how to see the application logs and try to find problems. Because the application logs can be distributed on many machines, as we can see in the figure below:


So from the outset of the project the logs should be a concern, as the project grows the trail of errors and success should be easily found. Because depending on the organization a mistake can cost a lot of money or even stop a business operation for a few hours causing a lot of damage.

A good stack that I have been using in the projects I have been working on is the ELK stack or Elastic Stack that is based on 3 main components, but I consider 4 because there is one in this very useful scenario:
  1. Elastic Search
  2. Logstash
  3. Kibana
  4. FileBeat

Elasticsearch is a highly scalable full-text search and analysis engine. It allows storing, searching and analyzing large volumes of data quickly and in near real time.
RESTful distributed search and analysis tool capable of solving a growing number of use cases. Like the heart of the elastic pile, it centrally stores your data so you can discover what's expected and discover the unexpected.

Logstash is a processing pipeline that ingests data from a multitude of sources at once, transforms it, and then sends it to ElasticSearch (in that case because it can send to other databases as well).

Data is usually scattered or spread across many systems in various formats. Logstash supports a variety of entries that draw events from multiple common sources all at the same time. Easily ingest your logs, metrics, web applications, data storage and various services.

As the data arrives, the Logstash filters analyze each event, identify the named fields to build the structure, and transform them to converge in a common format for analysis.

Kibana allows you to view your Elasticsearch data and navigate the data, creating filters, aggregations, count, combinations, that is, a visual way of navigating the data that is stored in ElasticSearch.
With Kibana you can create graphs of various types eg:


Filebeat helps keep things simple by offering a lightweight way to forward and center logs and files. Instead of making a tail in the file machine, the fileBeat agent does it for us.
In each machine where there is service is installed a fileBeat agent that will be in charge of observing the logs and forwards to its configured Logstash.

Instalação:

To configure this stack in the initial mode we can choose to have only one machine where we will put ElasticSearch, Logstash and Kibana.

NOTE: In the example below I am using a CentOS operating system.

ElasticSearch installation:


#sudo rpm --import https://artifacts.elastic.co/GPG-KEY-elasticsearch

create folder /etc/yum.repos.d/  and create file elasticsearch.repo

and add in file elasticsearch.repo these content:


[elasticsearch-5.x]
name=Elasticsearch repository for 5.x packages
baseurl=https://artifacts.elastic.co/packages/5.x/yum
gpgcheck=1
gpgkey=https://artifacts.elastic.co/GPG-KEY-elasticsearch
enabled=1
autorefresh=1
type=rpm-md


#sudo yum install elasticsearch


if everthing ok this command curl -XGET 'localhost:9200/?pretty' should return on Json with default content.

Logstash installation:

Fist Should be installed JAVA 8 or JAVA 9.


#sudo rpm --import https://artifacts.elastic.co/GPG-KEY-elasticsearch

create folder /etc/yum.repos.d/  and create file logstash.repo

and add in file logstash.repo these content:


[logstash-5.x]
name=Elastic repository for 5.x packages
baseurl=https://artifacts.elastic.co/packages/5.x/yum
gpgcheck=1
gpgkey=https://artifacts.elastic.co/GPG-KEY-elasticsearch
enabled=1
autorefresh=1
type=rpm-md


#sudo yum install logstash


With these tools working, we can already configure the stack to start ingesting data in ElasticSearch.

The first tool to be configured is Logtash.

Configuration:

Logstash: 
In the logstash config folder the INPUT, FILTER, and OUTPUT must be configured for the files that will be consumed in my example:


input {
    beats {
        port => "5043"
    }
}
filter {
    grok {
        match => { "message" => "\A%{TIMESTAMP_ISO8601}%{SPACE}%{LOGLEVEL}%{SPACE}%{INT}%{SPACE}%{SYSLOGPROG}%{SPACE}%{SYSLOG5424SD}%{SPACE}%{JAVACLASS:service}%{SPACE}%{NOTSPACE}%{SPACE}%{JAVALOGMESSAGE:java_message}"}
    }
    grok {
        match => { "message" => "\A%{TIMESTAMP_ISO8601}%{SPACE}%{SYSLOG5424SD}%{CRON_ACTION}%{JAVACLASS:servico}%{CRON_ACTION}%{SYSLOG5424SD}%{SPACE}%{JAVALOGMESSAGE:java_message}"}
   }
}
output {
    elasticsearch {
        hosts => [ "localhost:9200" ]
        index => [“my-example"]
    }
}

To build this pattern of GROK can be used this site http://grokconstructor.appspot.com , which gives the step by step to analyze the log.

After this configuration is applied, Logstash must be restarted.


FileBeat:

The agent must be configured machine by machine, a task that can be made easier using the ANSIBLE, which is triggered from only one machine adding the agent in the others:

Example, I created the file playbook-filebeat.yml, inside it has installation and configuration commands.


- hosts: "{{ lookup('env’,'HOST') }}"
  vars:
    http_port: 80
    max_clients: 200
  remote_user: my-user
  environment:
    AWS_ACCESS_KEY_ID: MYKEY 
    AWS_SECRET_ACCESS_KEY: MYSECRET
  tasks:
    - name: Stop FileBeat if running
      become: yes
      become_method: sudo
      shell: '/etc/init.d/filebeat stop'
      ignore_errors: yes
    - name: FileBeat download
      shell: "curl -L -O https://artifacts.elastic.co/downloads/beats/filebeat/filebeat-5.2.2-x86_64.rpm"
      ignore_errors: yes      
    - name: FileBeat Install
      become: yes
      become_method: sudo
      shell: "sudo rpm -vi filebeat-5.2.2-x86_64.rpm"
      ignore_errors: yes      
    - name: Install Pip with Curl and Python
      get_url: url=https://bootstrap.pypa.io/get-pip.py  dest='/home/ec2-user/'
      ignore_errors: yes
    - name: execute install script
      become: yes
      become_method: sudo
      shell: 'python /home/ec2-user/get-pip.py'
      ignore_errors: True
    - name: install aws cli
      become: yes
      become_method: sudo
      shell: 'pip install --upgrade --user awscli'
    - name: get script from s3
      become: yes
      become_method: sudo
      shell: '~/.local/bin/aws s3 cp s3://scripts/filebeat.conf-{{ENV}}.yml /etc/filebeat/filebeat.yml --region sa-east-1'
   
    - name: Stop FileBeat if running
      become: yes
      become_method: sudo
      shell: '/etc/init.d/filebeat start'
      ignore_errors: yes  

You can run this playbook with this command:


#ansible-playbook playbook-conf/playbook-filebeat.yml --private-key my_pem_file.pem  -e "HOST"=my.service.host


To avoid entering the machine and adding the configuration of FileBeat I put my configuration file in S3 and from inside the machines I look for this file.

FileBeat configuration file to be added in /etc/filebeat/filebeat.yml


filebeat.prospectors:
- input_type: log
  paths:
    - /logs/service1/service.log
output.logstash:
  hosts: ["logstash-host:5043”]


NOTE: If you do not want to use ANSIBLE, you can perform tasks manually.

With this structure running we can start consuming the application logs.
Example of Logs to be filtered by GROK pattern:


2017-07-04 11:11:37.921  INFO 60820 --- [pool-3-thread-1] br.com.service.ContaService      : GET DATA
2017-07-04 11:11:37.952  INFO 60820 --- [pool-3-thread-1] br.com.ContaServiceLog           :  CALL SOMEthing
2017-07-04 11:11:37.954  INFO 60820 --- [pool-3-thread-1] br.com.ContaServiceLog           : http://some-service


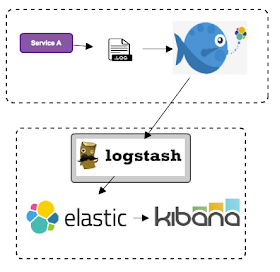
Now we have this structure working the structure according to the figure below:


The ELK stack is very powerful, from here we can create countless metrics, search, filters etc with the data that is inserted in ElasticSearch.

References :

terça-feira, 21 de março de 2017

Apache Mesos, Overview and Architecture

Apache Mesos is a cluster manager, or distributed kernel system and use the same principle than linux kernel.

It abstract CPU, memory, storage and other physical and virtual resources, like fault tolerance and elastic distribution.

The Mesos kernel run in all machines providing applications ( Hadoop, Spark, Kafka, Elasticsearch) with APIs to manage resource and scheduling to datacenter or cloud.

It has fault tolerance of master and agents using zookeeper.

Native suport container with Docker and others images AppC(Organisation for the App Container specification, including the schema and associated tooling)

Support isolation of CPU, memory, disk, ports, GPU.
HTTP APIs to develop new distributed applications, to operate the cluster and for monitoring.

Architecture


Mesos consists of a master daemon that manages agent daemons running on each cluster node and mesos frameworks that perform tasks on those agents.

The master allows the sharing of resources (CPU, RAM, ...) in structures and decides how many resources to offer each structure according to a given organizational policy, such as fair sharing or strict priority.

To support a diverse set of policies, the master employs a modular architecture that facilitates the addition of new allocation modules through a plug-in mechanism. 


A framework running on top of the Mesos consists of two components:
  •  a scheduler that registers with the master to be offered as a resource
  •  an executor process that is launched on agent nodes to perform the structure tasks.

The master determines how much feature is made available.
The scheduler determines which resource will be available

The figure below shows an example of how a structure is scheduled to perform a task. 


  1. Agent 1 reports to the master that it has 4 CPUs and 4GB of free memory. The master then invokes the allocation policy module and talks to the framework 1 that can offer its resources because they are free.
  2. The scheduler framework warns the master that it has two tasks to run in the agent and needs 2CPU and 1GB of memory and in the other task it needs 1 CPU and 2 GB of Memory.

Scheduling algorithm (Multilevel queue scheduling)

This algorithm can be used in situations where processes are divided into different groups.
Example: the division between foreground processes and background processes.
These two types of processes have different response times and requirements so you can have a different scheduling.
It is very useful for shared memory problems.


Reservation

Mesos provides mechanisms to reserve resources in specific Slaves.
Two types of Reservation:
  • Static Reservation
  • Dinamic Reservation (Default) 


Containerizer

  • Isolate a task from other running tasks.
  • Container tasks for running in resource-limited time environment.
  • Control individual task resources (eg CPU, memory) programmatically.
  • Run the software on a pre-packaged file system image, allowing it to run in different environments.

Types of containerizers

Mesos manages to work with different types of container besides Docker, but by default Less uses its own container
Container Type supported:
  • Composing
  • Docker
  • Mesos Composing containerizer
Is the possibility of working with Docker and Mesos Container at the same time.
You can launch an image of Docker as a Task, or as an Executor.

Mesos  container 

This container allows tasks to be performed by an isolated container array provided by the Mesos

Allows mesos to control Tasks at runtime without relying on other containers.
You can have control of OS operations like cgroups / namespace
Promises to have the latest container technologies
Enables control of Disk Usage Limit
Insulation can be customized by task
.
High-Availability Mode


If the Master becomes unavailable, existing tasks will continue to run, but new features can not be. Allocated and new tasks can not be launched.
To reduce the possibility of this occurring, Mesos uses multiples, one active and several backups in case of failure.
Whoever coordinates the election of the new master is the Zookeper.

Mesos also use Apache Zookeeper, part of Hadoop, to synchronize distributed processes to ensure all clients receive consistent data and assure fault tolerance.

Nodes Discovery -> Is done by Zookeeper


When a network partition occurs and disconects a component (master, agent, or schedule) from the ZooKeeper, the master detects and induces a timeout.


Observability Metrics

The information reported by the mesos includes details about availability of resources, use of resources, registered frameworks,
Active agents and tasks state.
It is possible to create automated alerts and put different metrics in a dashboard.

Mesos provides two types of metrics:

Counter -> Accompanying the growth and the reduction of events

Gauges -> Represents some values of instantant magnitude


When you start a task, you can create a volume that exists outside the BOX of the task and persist even after the task is executed or completed.
Persistent Volumes

Mesos provides a mechanism to create a persistent volume of disk resources.
When the task finishes, its capabilities - including the persistent volume - can be offered back to the structure so that the structure can start the same task again, start a recovery task, or start a new task that consumes the previous task output as Your entry.
Persistent volumes allow services such as HDFS and Cassandra to store their data within the Mesos. 


The Mesos Replicated Log

Mesos provides a library that allows you to create fault-tolerant replicated logs;
This library is known as the replicated log.
The Mesos master uses this library to store cluster state in a replicated and durable way;
The library is also available for use by frameworks to store the replicated structure state or to implement the common pattern of "replicated state machine".
Replicated Log is often used to allow applications to manage the replicated state in a strong consistency. 

Mesos  Frameworks:

  • Vamp is a deployment and workflow tool for container orchestration systems, including Mesos/Marathon. It brings canary releasing, A/B testing, auto scaling and self healing through a web UI, CLI and REST API.
  • Aurora is a service scheduler that runs on top of Mesos, enabling you to run long-running services that take advantage of Mesos' scalability, fault-tolerance, and resource isolation.
  • Marathon is a private PaaS built on Mesos. It automatically handles hardware or software failures and ensures that an app is “always on”.
  • Spark is a fast and general-purpose cluster computing system which makes parallel jobs easy to write.
  • Chronos is a distributed job scheduler that supports complex job topologies. It can be used as a more fault-tolerant replacement for Cron.


Mesos offers many of the features that you would expect from a cluster manager, such as:

  • Scalability to over 10,000 nodes
  • Resource isolation for tasks through Linux Containers
  • Efficient CPU and memory-aware resource scheduling
  • Highly-available master through Apache ZooKeeper
  • Web UI for monitoring cluster state
References:

sexta-feira, 3 de fevereiro de 2017

JSON Web Token, Security for applications


JSON Web Token called JWT, is an open standard RFC 7519 that defines a compact and self-contained way for securely transmitting information between parties as a JSON object. 
Each information can be verified and trusted because it is digitally signed. 
JWTs can be signed using a secret (with the HMAC algorithm) or a public/private key pair using RSA.

Some importants concepts:
  • Compact: JWTs can be sent through a URL, POST parameter, or inside an HTTP header. 
  • Self-contained: The payload contains all the required information about the user, avoiding the need to query the database more than once.

When should you use JSON Web Tokens:
  • Authentication: This is the most common scenario for using JWT. Once the user is logged in, each subsequent request will include the JWT, allowing the user to access routes, services, and resources that are permitted with that token. 
  • Information Exchange: JSON Web Tokens are a good way of securely transmitting information between parties, because as they can be signed, for example using public/private key pairs, you can be sure that the senders are who they say they are. 

JWT Structure:

A complete JWT is represented something like this:

eyJhbGciOiJIUzI1NiIsInR5cCI6IkpXVCJ9.eyJleHAiOjEzODY4OTkxMzEsImlzcyI6ImppcmE6MTU0ODk1OTUiLCJxc2giOiI4MDYzZmY0Y2ExZTQxZGY3YmM5MGM4YWI2ZDBmNjIwN2Q0OTFjZjZkYWQ3YzY2ZWE3OTdiNDYxNGI3MTkyMmU5IiwiaWF0IjoxMzg2ODk4OTUxfQ.uKqU9dTB6gKwG6jQCuXYAiMNdfNRw98Hw_IWuA5MaMo

This token could be sliced in 3 parts:

Header:
eyJhbGciOiJIUzI1NiIsInR5cCI6IkpXVCJ9.

Payload:
eyJleHAiOjEzODY4OTkxMzEsImlzcyI6ImppcmE6MTU0ODk1OTUiLCJxc2giOiI4MDYzZmY0Y2ExZTQxZGY3YmM5MGM4YWI2ZDBmNjIwN2Q0OTFjZjZkYWQ3YzY2ZWE3OTdiNDYxNGI3MTkyMmU5IiwiaWF0IjoxMzg2ODk4OTUxfQ.

Signature:
uKqU9dTB6gKwG6jQCuXYAiMNdfNRw98Hw_IWuA5MaMo

Each part is separated by “.” 
<base64url-encoded header>.<base64url-encoded claims>.<base64url-encoded signature>

Here one simple sample of the flow to authentication of User to access a API Server.

terça-feira, 3 de janeiro de 2017

Automating Infrastructure on Premise or Cloud with Ansible

Ansible Tasks are idempotent. Without a lot of extra coding, bash scripts are usually not safety run again and again. Ansible uses "Facts", which is system and environment information it gathers ("context") before running Tasks.

Design Principles

  • Have a dead simple setup process and a minimal learning curve
  • Manage machines very quickly and in parallel
  • Avoid custom-agents and additional open ports, be agentless by leveraging the existing SSH daemon
  • Describe infrastructure in a language that is both machine and human friendly
  • Focus on security and easy auditability/review/rewriting of content
  • Manage new remote machines instantly, without bootstrapping any software
  • Allow module development in any dynamic language, not just Python
  • Be usable as non-root
  • Be the easiest IT automation system to use, ever.

Ansible by default manages machines over the SSH protocol.

Once Ansible is installed, it will not add a database, and there will be no daemons to start or keep running. You only need to install it on one machine (which could easily be a laptop) and it can manage an entire fleet of remote machines from that central point. When Ansible manages remote machines, it does not leave software installed or running on them, so there’s no real question about how to upgrade Ansible when moving to a new version.

Playbooks could be considered the main concept in Ansible.

Playbooks are Ansible’s configuration, deployment, and orchestration language. They can describe a policy you want your remote systems to enforce, or a set of steps in a general IT process.

At a basic level, playbooks can be used to manage configurations of and deployments to remote machines. At a more advanced level, they can sequence multi-tier rollouts involving rolling updates, and can delegate actions to other hosts, interacting with monitoring servers and load balancers along the way.

Playbooks are designed to be human-readable and are developed in a basic text language.

Playbooks are expressed in YAML format and have a syntax, which intentionally tries to not be a programming language or script, but rather a model of a configuration or a process.

In my example, set two virtual machines with Vagrant, where the first I put Ansible installed and the second I applied some configurations.


Configure multi-machine like this in my previous post

Vagrantfile to multi-machine:

 Vagrant.configure(2) do |config|  
  config.vm.box = "ubuntu/trusty64"  
  config.vm.define "machine1" do |node1|  
    node1.vm.network "private_network", ip: "192.168.0.101"  
    node1.vm.hostname = "machine1"  
    node1.vm.provider "virtualbox" do |v|  
     v.memory = 1024  
     v.cpus = 1  
   end  
  end  
  config.vm.define "machine2" do |node2|  
    node2.vm.network "private_network", ip: "192.168.0.102"  
    node2.vm.hostname = "machine2"  
    node2.vm.provider "virtualbox" do |v|  
     v.memory = 1024  
     v.cpus = 1  
   end  
  end  
 end  

On machine1 install Ansible with these commands below:

#vagrant ssh machine1

If ask for password put “vagrant"

Commands to Install Ansible:

  1.  sudo apt-get install software-properties-common
  2.  sudo apt-add-repository ppa:ansible/ansible
  3.  sudo apt-get update
  4.  sudo apt-get install ansible

Edit /etc/ansible/hosts  and add IPs (192.168.0.101 , 192.168.0.102)

To check if everything ok run this command: 

ansible all -m ping -s -k -u vagrant

Result should be:
machine2 | SUCCESS => {
    "changed": false,
    "ping": "pong"

}

First Playbook is to install java and tomcat in second machine.

playbook-tomcat.yml :

 - hosts: machine2  
  vars:  
   http_port: 80  
   max_clients: 200  
  remote_user: vagrant  
  tasks:  
   - name: updates a server  
    apt: update_cache=yes  
   - name: upgrade a server  
    apt: upgrade=full  
   - name: install java   
    apt: name=default-jdk state=latest  
   - name: install tomcat  
    apt: name=tomcat7 state=latest  
   - name: make sure apache is running  
    service: name=tomcat7 state=started  

ansible-playbook playbook-tomcat.yml -sudo -u vagrant --ask-pass